New Delhi: Prime Minister Narendra Modi ordered a nationwide lockdown on March 24, 2020, limiting movement of the entire 1.3 billion population of India as a preventive measure against the COVID-19 pandemic in the country with conditional relaxation unfolding only after 40 days. During the initial phase, the movement was completely restricted and public transport was entirely banned, restricting mobility to a great extent. In addition to this, travel and delivery of non-essential activities were completely paused. This further led to a decline in engagement and time spent on e-commerce apps and cab aggregators, also adding to the mobility restriction.
India’s leading AI innovation company Bobble AI in partnership with Trapyz, a consumer insights platform has released a comprehensive data report that assesses the impact of COVID-19 on real-world visitation across categories. The 91 days data (March 1 to May 30) captures mobility insights across categories like retail stores, restaurants, banks, ATMs, and markets in India defining pre and post lockdown effects. Along with mobility, Bobble AI has also released a thorough analysis of digital traffic across mobile applications during the four phases of lockdown. The report illustrates the consumption patterns, and user behavior on smartphones ever since the nation-wide lockdown has been imposed.
*Disclaimer – This trend report is based upon the privacy-compliant visitation data sourced from 63 Million devices across 640+ cities in India (without any PII). These are anonymized and aggregated insights during the COVID-19 outbreak in India. This information is made available by Bobble AI for educational purposes as well as to broadcast general information on the usage of various apps and websites.
Bobble AI data intelligence and analysis shows:
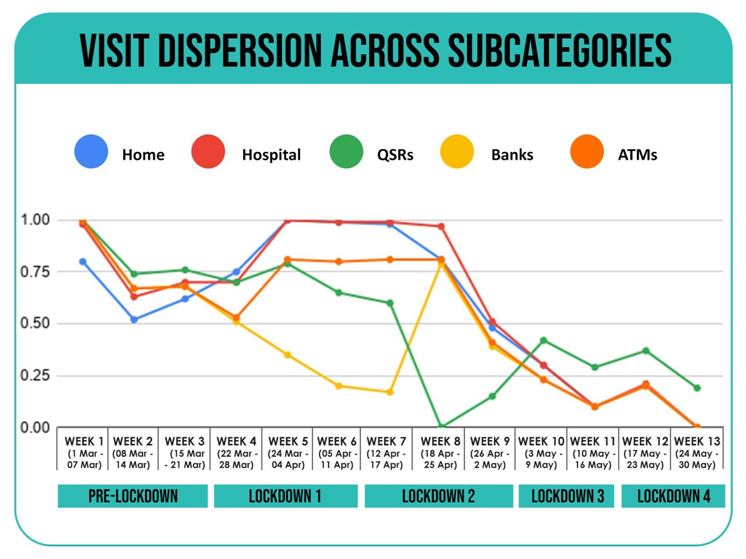
Visits across categories
Indian population’s visitation dispersion changed across categories, with a steady increase in people staying in their residential places, and or visits to essential service centers such as – hospitals, clinics, medical stores, banks, ATMs. Lockdown 2 witnessed the maximum number of people staying at home.
Healthcare
● Hospitals, clinics, and medical stores across 640 cities registered a steep jump.
Visits in the health and fitness category were almost 4 times the visits registered to supermarkets
Banking and Insurance
● Right after the lockdown, banking and financial institutions register an increase in visits
● ATMs and hospitals emerge as the most visited sub-categories
Departmental Stores
● With some relaxations in Lockdown 2 visits to department stores show a week on week spurt.
● However, overall visits continue to decline. Supermarkets also show a similar pattern.
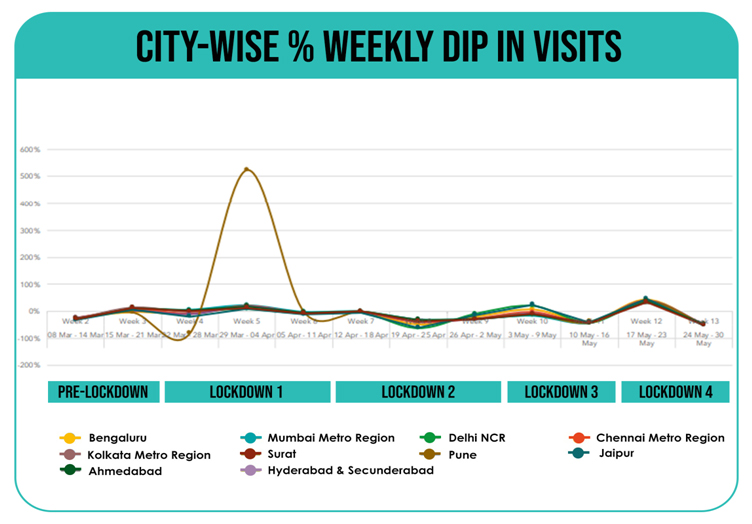
Where did the people travel across India during the lockdown?
● Some cities like Surat, Ahmedabad, and Jaipur show a week on week spurt in visits in Lockdown 1 as compared to other cities
o Pune witnessed a 530% increase in terms of mobility during the first Lockdown, as result a sudden jump in COVID-19 cases is evident.
● Cities like Delhi and Mumbai haven’t registered a decrease in visits after the lockdown. As a result, the rise in COVID-19 cases in such cities is evident.
● With creeping relaxations –
o In lockdown 2, there is a 30% increase in visits in Delhi, Mumbai, and Jaipur There was a 50% spike in terms of mobility across cities in lockdown 3
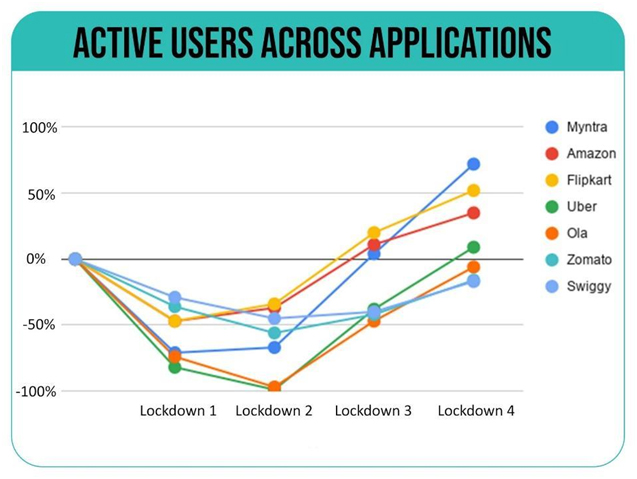
In terms of application usage – where did the people order from?
Ecommerce applications– Amazon, Myntra and Flipkart
● E-commerce applications such as Myntra, Amazon, and Flipkart witnessed an enormous 52% dip in time spent, with a 63% decrease in engagement and a 46% drop in active user count during the first phase of lockdown.
● In the third phase of lockdown leading up to the recent times, the gradual relaxation of supply chain and logistics for non-essential items has helped e-commerce applications to register a jump in users’ time spent and active user count, which is 50% over the initial fall.
Food delivery applications – Zomato and Swiggy
● During the first phase of lockdown, food delivery applications such as Zomato and Swiggy observed a 41% decrease in time spent, a 67 % steep in engagement, and a 34% decline in active user count and are still struggling to regain their popularity.
Cab hailing Apps
● In the first phase of lockdown, cab-hailing applications such as Uber and Ola registered a massive drop of 83% in time spent, 82% in engagement and 76% dip in the active user count
● While after the first phase, with each lockdown, cab-hailing applications observed an average of 41% increase in time spent and a 13% increase in engagement.